CloudInfosys
Social Enterprise
Social Enterprise
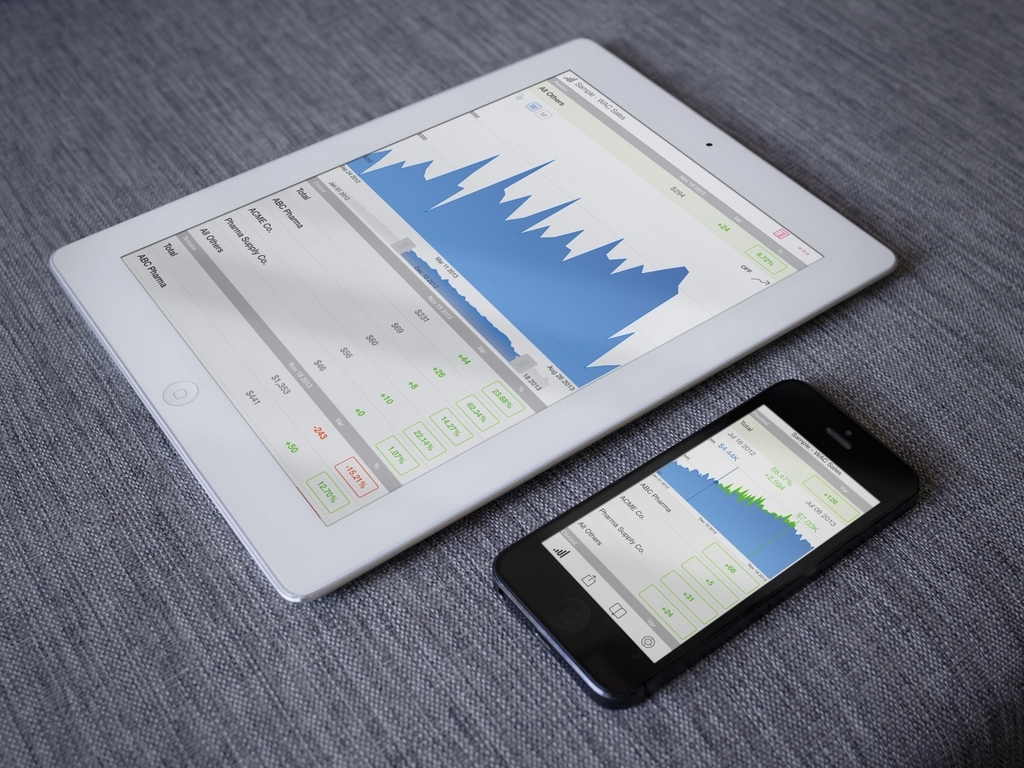
Stunning mobile visualizations that bring your data to life on any device.
Roambi Analytics (formerly ES4) delivers over a dozen proprietary chart types optimized for touch interaction on iOS and Android. Users can swipe, pinch, and tap their way through enterprise data without any technical training.
All Roambi reports work offline — your team stays productive even when connectivity is unavailable. Data syncs automatically when back online.